
This suite of dashboards and alerts helps you proactively maintain a high-quality integration with the Google Home ecosystem. Google is committed to supporting partners in developing a high quality ecosystem for all customers.
The dashboard has three sections, each covering a key part which contributes to the quality of an overall integration.
Google to Partner Metrics - Measures the health of calls from Google to your cloud backend.
System Health - Partner to Google Metrics - Measures the health of calls from your system to Google.
Device Health - State Accuracy - Measures the accuracy of states stored in Google systems, which are used to serve user queries.
When metrics don't meet their target values, they are highlighted in red to indicate an issue that could impact the user experience. The following information provides details on each target and why it matters to your users.
If the following button doesn't take you directly to the dashboard, you can get to it by selecting the Overview page, select Dashboards and then from the My Dashboards list select Google Home Vitals Dashboard (Cloud) to view your dashboard.
Google to Partner metrics
The Query/Execute Success Rate >= 99.5% metric measures how often users' commands are fulfilled correctly, which helps avoid Assistant responses such as "I can't reach the device" or incorrectly confirming a command that wasn't fulfilled yet.
What defines a "Success"?
A transaction is marked as a success if the Google Home platform receives a valid response indicating the intended action was fulfilled or the requested state was retrieved.
Responses that include non-blocking exceptions (for example, a SUCCESS status
accompanied by a lowBattery exception) are counted as successful transactions.
The command reached the device and the intent was satisfied despite the warning.
What defines a "Failure"?
The errors found on Common platform error codes which are marked as Partner Actionable are considered "Failures" when calculating the QUERY and EXECUTE Success Rates. Additionally, the errors found on Errors and exceptions are also "Failures", with the following exceptions:
| Failure exceptions | ||
|---|---|---|
| aboveMaximumLightEffectsDuration | armLevelNeeded | inOffMode |
| alreadyArmed | bagFull | lockedToRange |
| alreadyAtMax | belowMinimumLightEffectsDuration | lowBattery |
| alreadyAtMin | binFull | maxSpeedReached |
| alreadyClosed | cancelArmingRestricted | minSpeedReached |
| alreadyDisarmed | deadBattery | notSupported |
| alreadyDocked | degreesOutOfRange | offline |
| alreadyInState | deviceJammingDetected | percentOutOfRange |
| alreadyLocked | deviceNotMounted | rangeTooClose |
| alreadyOff | deviceNotReady | relinkRequired |
| alreadyOn | deviceOffline | remoteSetDisabled |
| alreadyOpen | deviceTurnedOff | safetyShutOff |
| alreadyPaused | discreteOnlyOpenClose | targetAlreadyReached |
| alreadyStarted | functionNotSupported | tooManyFailedAttempts |
| alreadyStopped | inAutoMode | valueOutOfRange |
| alreadyUnlocked | inEcoMode |
The Query/Execute Latency (p90) <= 1000ms metric measures requested action wait time and helps ensure users don't have to wait too long, for example, waiting a few seconds for their light to turn off.
Latency metrics
Latency is a critical indicator of how responsive your integration feels to the end-user. The dashboard tracks the 90th Percentile (P90) Latency, which represents the experience of your "slowest" users (for example, a P90 of 800ms means 90% of requests are acknowledged in 800ms or less).
Google measures latency differently for status checks versus device commands to ensure technical accuracy.
1. QUERY Latency (Interrogative)
This measures the Cloud-to-cloud round trip time when Google asks for the current state of a device.
- Start: Google dispatches an
action.devices.QUERYrequest to your fulfillment URL. - Measurement Window: The time taken for your cloud to receive, process, and transmit the full HTTP response back to Google.
- End: Google receives and acknowledges the final response payload from your service.
2. EXECUTE Latency (Action)
This measures the command acknowledgment time when Google sends a control request to a device.
- Start: Google dispatches an
action.devices.EXECUTErequest to your fulfillment URL. - Measurement Window: The time taken for your cloud to receive the command and return an acknowledgment response.
- End: Google receives the
SUCCESS,PENDING, orOFFLINEstatus response. - Technical Scope: This metric measures the "Response Ack" time between Google's cloud and your cloud. It does not measure the time it takes for the physical hardware (for example, a lightbulb) to complete the physical state change, as that often involves local mesh network latency outside of the cloud-to-cloud path.
EXECUTE/QUERY latency timeline breakdown
When analyzing timestamps for an EXECUTE or QUERY latency, the total
round-trip time can be broken down into the following sequential flow:
Since this breakdown compares Google side and Partner side timestamps,
Partner servers must be synchronized with NTP (Network Time Protocol). Even a
minor clock drift (50-100ms) will distort the calculated transit times (t2 -
t1 and t4 - t3), potentially leading to logically impossible metrics like
negative transit latencies.
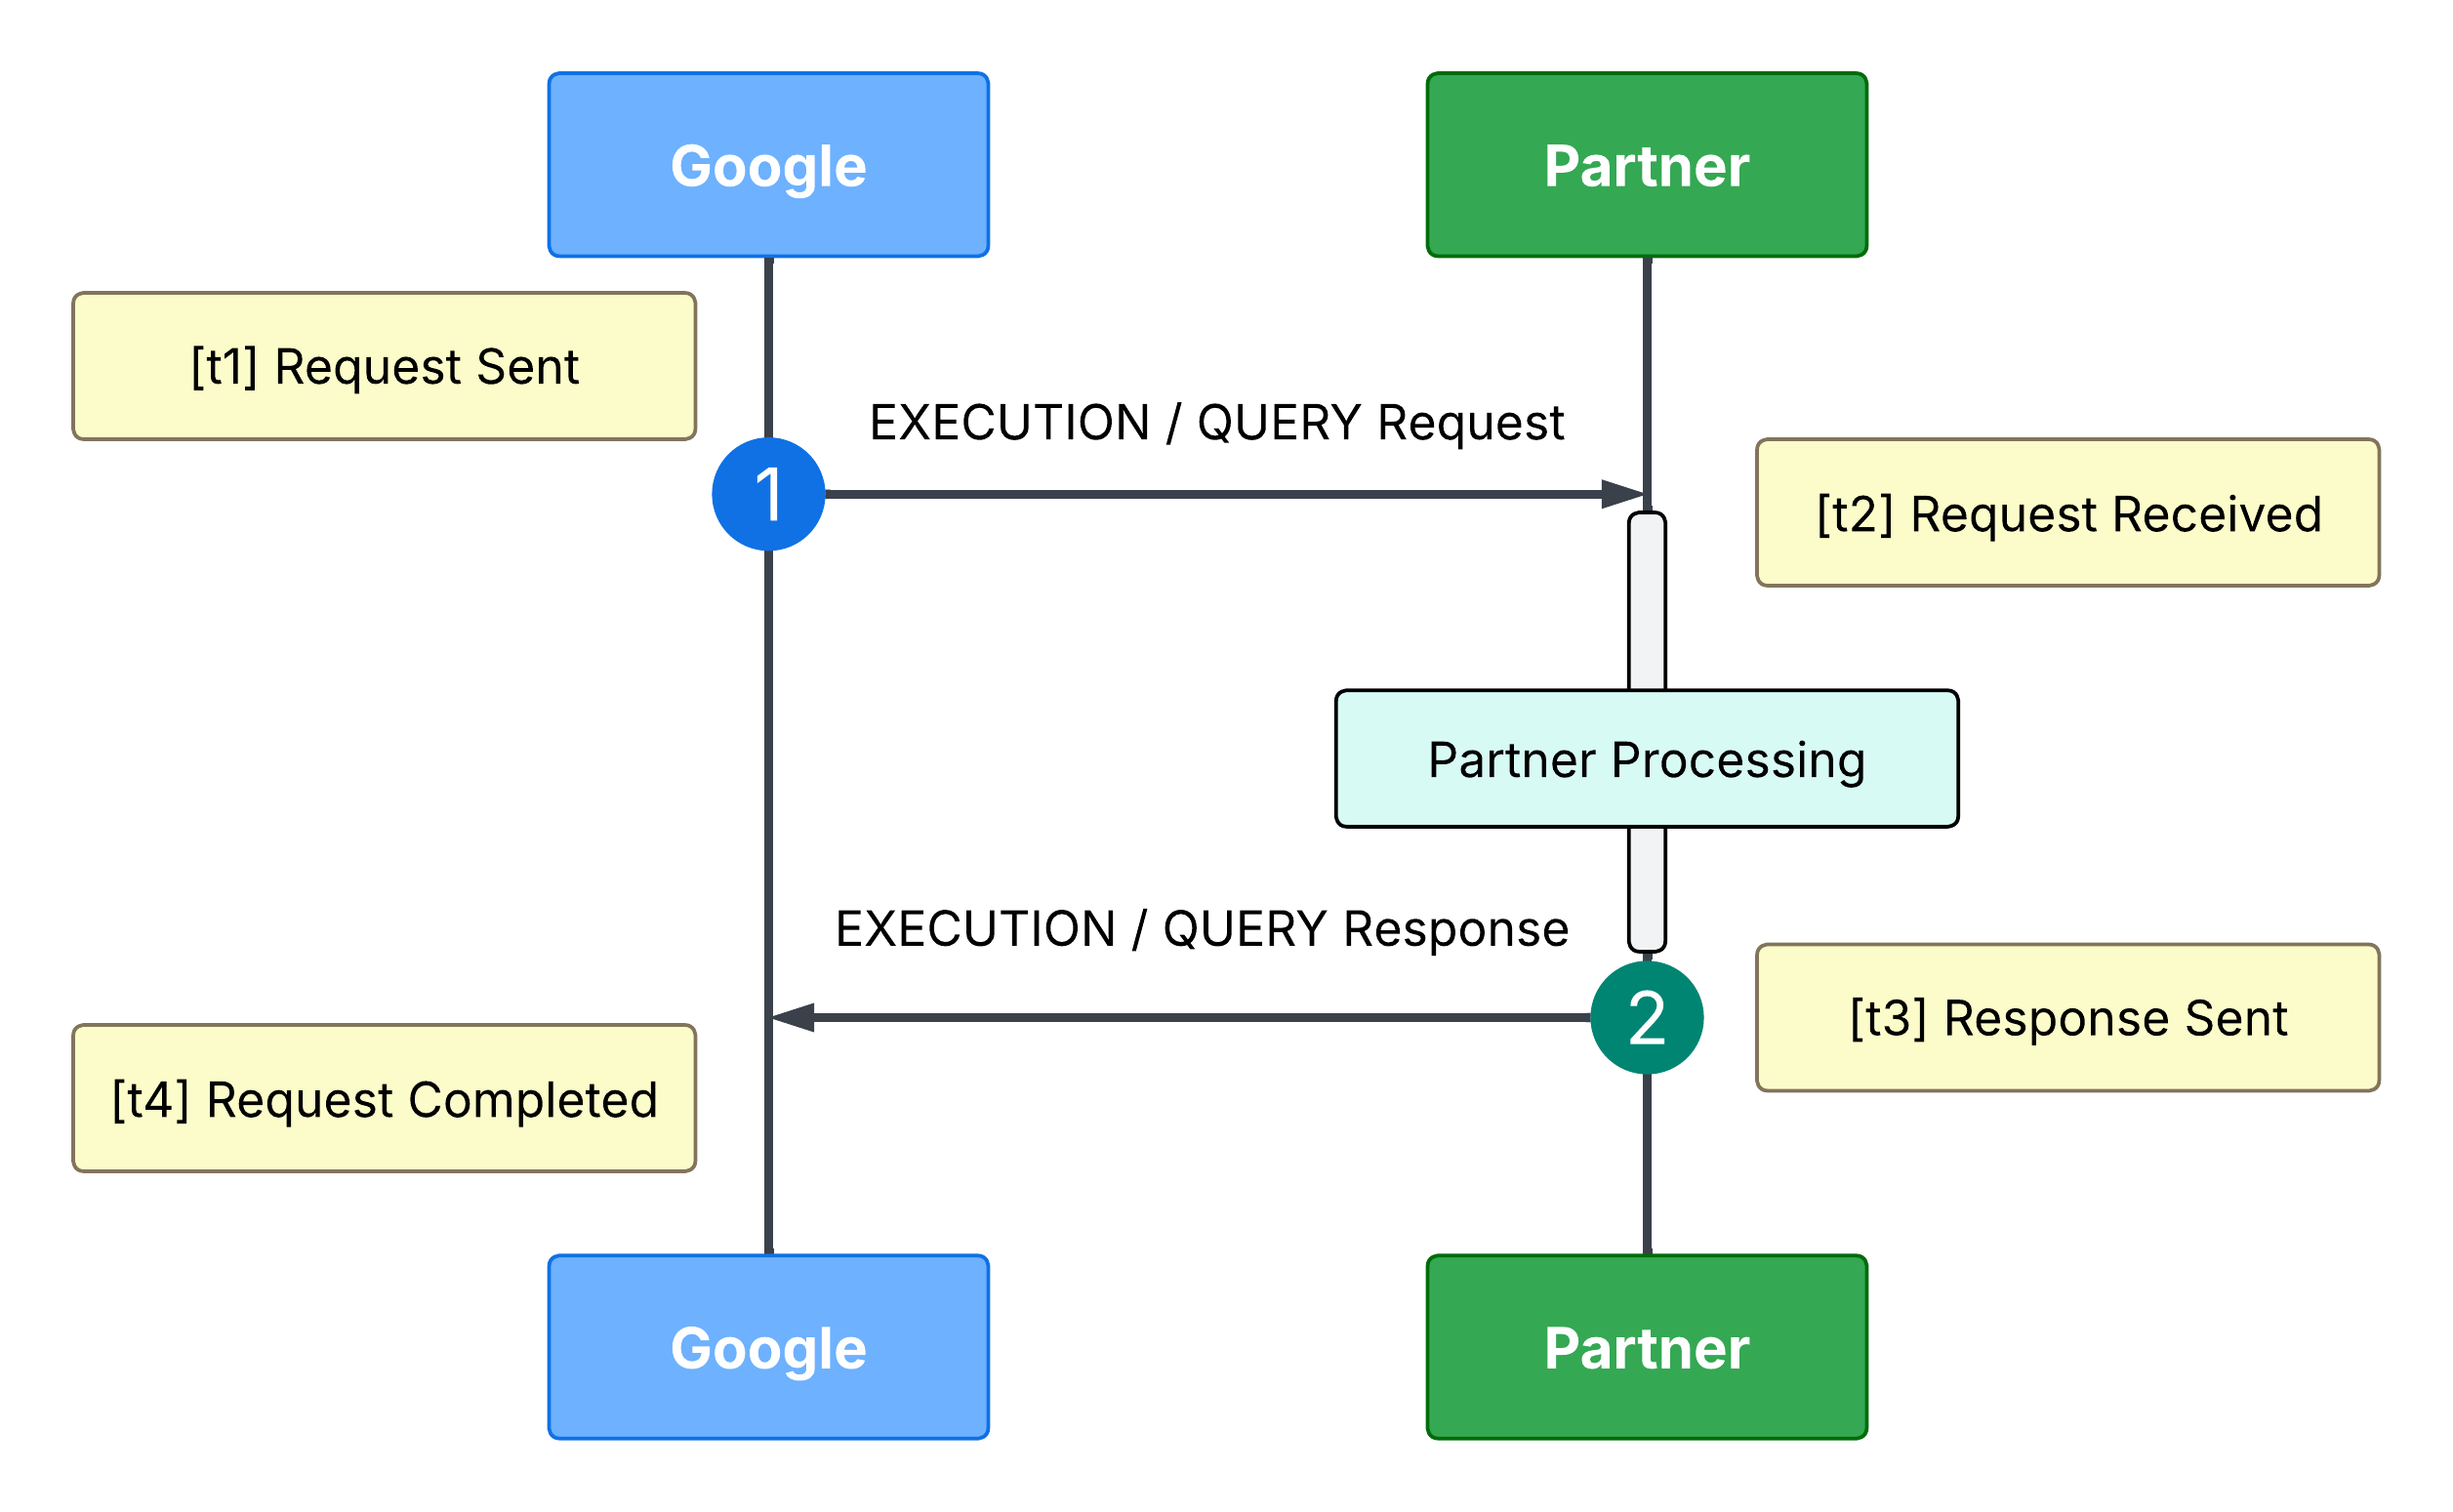
[t1] Request Sent (Google Outbound): Google initiates the intent
request. Because t1 is not directly exposed, it is approximately
calculated by subtracting the total latency from the final inbound
timestamp.
Network Transit (t1 to t2): The estimated network transit and
queue time before reaching your fulfillment endpoint.
[t2] Request Received (Partner Ingress): The exact timestamp when the
request arrives at your environment's API gateway or ingress server.
Partner Processing (t2 to t3): The internal execution, routing,
and device handling latency entirely within your cloud environment.
[t3] Response Sent (Partner Egress): The timestamp when your service
dispatches the fulfillment response back to Google.
Return Transit (t3 to t4): The return network routing and connection
completion time back to Google.
[t4] Request Finalized (Google Inbound): Google receives and processes
the final response. This timestamp is explicitly recorded in your
Google Cloud logs as receiveTimestamp.
To illustrate how these metrics tie together, consider a sample EXECUTE
request with a total logged latency (latencyMsec) of 1700 ms and a
Google Cloud receiveTimestamp (t4) of
2026-05-25T15:25:00.550Z.
| Stage / Checkpoint | Timestamp / Duration | Source & Calculation Method |
|---|---|---|
[t1] Google Outbound |
15:24:58.850Z |
Calculated: t4 (.550Z) - 1700ms |
| Network Transit | 150 ms | Derived: t2 - t1 |
[t2] Partner Ingress |
15:24:59.000Z |
Observed: Recorded in Partner gateway logs |
| Partner Processing | 1300 ms | Derived: t3 - t2 (Your internal execution time) |
[t3] Partner Egress |
15:25:00.300Z |
Observed: Recorded in Partner egress logs |
| Return Transit | 250 ms | Derived: t4 - t3 |
[t4] Google Inbound |
15:25:00.550Z |
Observed: receiveTimestamp in Google Cloud logs |
Latency reduction options
Architectural recommendations for geo-routing
If Anycast IP implementation is not feasible, we recommend the following cost-effective alternatives to ensure users are served by the closest regional data center.
Global Load Balancing (GLB)
Instead of static routing, use a Global Application Load Balancer (available from most major cloud providers).
How it works: You configure a single global entry point (URL) that sits at the network edge. The load balancer automatically detects the geographic origin of the request from Google's fulfillment clusters and routes the traffic to your nearest regional healthy backend.
Benefit: This provides the performance of Anycast with significantly lower configuration complexity and cost.
Geo-Location Aware DNS (GeoDNS)
How it works: Configure your DNS provider to resolve your fulfillment URL to different IP addresses based on the geographic location of the DNS query.
Implementation: Ensure your DNS provider is optimized for Google's egress points. When Google's regional fulfillment services (for example, in the US, EU, or Asia) resolve your domain, they will receive the IP address for the data center in that specific region.
Optimization strategies at the application layer
Beyond infrastructure-level routing, you can implement the following strategies at the application layer to reduce latency in request processing.
The "Trampoline" Proxy Method
If you must maintain a primary data center, use regional lightweight proxy servers (Trampolines) to handle the initial handshake.
Google hits your global URL.
A regional proxy (for example, a lightweight Nginx or Lambda function) receives the request.
The proxy forwards the payload over your internal, high-speed backbone to the primary database.
Benefit: This reduces the "TCP Handshake" time, which is often the largest contributor to latency for long-distance requests.
Access Token Region Hints
During the Account Linking (OAuth) process, your system can identify the user's home region.
Implementation: Encode a region identifier into the
access_tokenissued to Google. When Google sends a fulfillment request, your gateway can immediately inspect the token and route the request to the correct regional cluster without needing a database lookup.
System Health - Partner to Google metrics
Maintaining a Success Rate >= 99.5% helps ensure that device states are correct in Google Home, devices are added and removed, automations trigger, and history events appear in the Google Home app (GHA)'s Activity tab.
The Success Rate is calculated based on the HTTP response codes returned by Google when your cloud pushes state updates. To ensure partners are not penalized for Google-side infrastructure issues, the metric excludes Google internal errors from the failure count. The API calls included in the calculation are found in the HomeGraph API reference.
What defines a "Success"?
2xx (Success): The state update was successfully received and processed by Home Graph.
What defines a "Failure"?
4xx (Partner Error) represent failures and indicate an issue with the request sent from your cloud. Common codes include:
400 Bad Request
Cause: The server was unable to process the request due to invalid syntax. Common causes include malformed JSON or using null instead of "" for a string value.
Solution: Ensure the request body is valid JSON (no malformed structure or
null values for string fields), and verify that agentUserId matches the value
from the SYNC response.
404 Not Found
Cause: deviceId or agentUserId not found in HomeGraph (not synced yet,
already unlinked, or ID mismatch).
Solution:
- Ensure that the
agentUserIdmatches the value provided in your SYNC response. - Use the Home Graph SYNC API to determine whether the 404 Not Found error is caused by a missing device or user in HomeGraph.
- Make sure to trigger
requestSyncafter device or account add, remove, rename, or update to ensure the state stays up to date. - Properly handle
DISCONNECTintents to stop reporting stale devices. After receiving theDISCONNECTintent, your cloud service should cease publishing changes to Google with Request Sync and Report State.
429 Resource Exhausted
Cause: Your integration has exceeded its allotted quota.
Solution: See the instructions in the "Step 2a: Debug Quota Issues" section in the dashboard for quota management. You can also refer to Smart Home quotas and limits for more information.
Device Health - State accuracy
Meeting or exceeding a State Accuracy >= 99.5% helps ensure users see correct results when they view device states or use AI features like Ask Home. If state accuracy is low, automations may not fire and history entries may not appear in the GHA's Activity tab at the right time. For more information, see Report State. Please note: The State Accuracy target must be met across ALL supported traits.
1. Accuracy Components
The metric is derived from "samples" where Google can verify the reported state against a known intent outcome. For technical precision, accuracy is evaluated across two distinct pathways:
- QUERY based Accuracy: Verified when a user or system actively interrogates the current status of a device.
- EXECUTE based Accuracy: Verified by evaluating the post-command device state reported back following a control request.
2. Dashboard Metrics (Hourly Calculation)
The dashboard calculates accuracy based on a 1-hour interval. To ensure statistical confidence and avoid penalizing integrations on low-signal noise, Google enforces a minimum traffic volume threshold. If a specific trait and device combination accumulates fewer than 100 total samples over a rolling 5-day window, its accuracy is considered statistically insignificant and is set to N/A.
When an hour has sufficient sample volume across both pathways, the baseline hourly accuracy for a specific state is computed as the average of the two independent percentages:
Hourly State Accuracy = (Query Accuracy % + Execution Accuracy %) / 2
Where each pathway is defined as:
- Query Accuracy % = (Hourly Query Accurate Samples) / (Hourly Query Total Samples)
- Execution Accuracy % = (Hourly Execution Accurate Samples) / (Hourly Execution Total Samples)
Trait Accuracy Score (calculated per trait) = SUM(Query Accurate Samples + Execution Accurate Samples) / SUM(Query Total Samples + Execution Total Samples)
Because the Quality Score evaluates the strict minimum performance across your ecosystem, every single supported and eligible trait must individually meet the >= 99.5% State Accuracy target (this is not an average across traits).
This view prevents high-volume devices with excellent accuracy from masking accuracy issues on lower-volume devices. Partners concerned about underutilized traits lowering their score can be assured that a rarely used trait is automatically protected by the minimum traffic volume check and won't be factored into the Lowest Type and Trait score unless it meets the required sample threshold.
3. Improving Device Health & State Accuracy
Discrepancies occur when the state stored in the Home Graph does not match the results of a real time QUERY.
"Missing Field" errors
DETAILED_ACCURACY_RESULT_QUERY_STATE_MISSING_FIELD example
reportStateLog: {
    accuracy: "INACCURATE"
    agentId: "abc"
    detailedAccuracyResult: "DETAILED_ACCURACY_RESULT_QUERY_STATE_MISSING_FIELD"
    deviceId: "curtain"
    deviceType: "action.devices.types.CURTAIN"
    isMissingField: true
    isOffline: false
    queriedTime: "2026-04-13T12:20:26Z"
    queryReportStateDifferences: {
      queryState: "open_close    {
        open_percent: 0.0
        missing open_direction
      }"
      reportState: "open_close   {
        open_state {
          open_percent: 100.0
          open_direction: "LEFT"
        }
      }"
    }
    reportedTime: "2022-05-13T07:14:35Z"
    requestId: "123"
    result: "INACCURATE"
    snapshotTime: "2026-04-13T12:20:26Z"
    stateName: "open_state"
    traitName: "TRAIT_OPEN_CLOSE"
  }
DETAILED_ACCURACY_RESULT_REPORT_STATE_MISSING_FIELD example
reportStateLog: {
    accuracy: "INACCURATE"
    agentId: "abc"
    detailedAccuracyResult: "DETAILED_ACCURACY_RESULT_REPORT_STATE_MISSING_FIELD"
    deviceId: "sensor"
    deviceType: "action.devices.types.SENSOR"
    isMissingField: true
    isOffline: false
    queriedTime: "2026-04-28T10:40:33Z"
    queryReportStateDifferences: {
      queryState: "temperature_setting {
         thermostat_mode: "off"
         thermostat_temperature_ambient: 20.0
         active_thermostat_mode: "none"
      }"
      reportState: "temperature_setting {
         thermostat_mode: "off"
         active_thermostat_mode: "none"
      }"
    }
    reportedTime: "2024-09-20T15:00:00Z"
    requestId: "123"
    result: "INACCURATE"
    snapshotTime: "2026-04-28T10:40:33Z"
    stateName: "thermostat_temperature_ambient"
    traitName: "TRAIT_TEMPERATURE_SETTING"
  }
Cause: With the DETAILED_ACCURACY_RESULT_QUERY_STATE_MISSING_FIELD or the
DETAILED_ACCURACY_RESULT_REPORT_STATE_MISSING_FIELD error, the set of payload
fields differs between your QUERY response and your Report State request for
the same device.
Solution: Ensure the data structure is identical in both pathways. If a trait is included in SYNC, its corresponding fields must be present and consistent in both proactive reports and reactive queries.
"Inaccurate" errors
DETAILED_ACCURACY_RESULT_INACCURATE example
reportStateLog: {
    accuracy: "INACCURATE"
    agentId: "abc"
    detailedAccuracyResult: "DETAILED_ACCURACY_RESULT_INACCURATE"
    deviceId: "outlet"
    deviceType: "action.devices.types.OUTLET"
    isMissingField: false
    isOffline: false
    queriedTime: "2026-04-12T16:02:58Z"
    queryReportStateDifferences: {
      queryState: "on_off    {
        on: false
      }"
      reportState: "on_off   {
        on: true
      }"
    }
    reportedTime: "2025-03-10T01:56:44Z"
    requestId: "abc"
    result: "INACCURATE"
    snapshotTime: "2026-04-12T16:02:58Z"
    stateName: "on"
    traitName: "TRAIT_ON_OFF"
  }
Cause: For the DETAILED_ACCURACY_RESULT_INACCURATE error, there is a
discrepancy between the value returned in the QUERY response and the last
Report State value.
Solution: Ensure Report State is triggered whenever a device status changes and that both Report State and QUERY always provide the exact same, up-to-date values and all required fields to maintain data consistency.
DETAILED_ACCURACY_RESULT_MISSING_REPORT_STATE example
"reportStateLog": {
   "isMissingField": false,
   "snapshotTime": "2026-04-13T07:56:21Z",
   "traitName": "TRAIT_ON_OFF",
   "detailedAccuracyResult": "DETAILED_ACCURACY_RESULT_MISSING_REPORT_STATE",
   "executionReportStateDifferences": {
      "expectedPostExecutionDeviceState": {
         "onOff": {
         "on": false
         }
      },
      "preExecutionDeviceState": {
         "onOff": {
         "on": true
         }
      },
      "executionCommand": {
         "requestId": "test001",
         "beginTimestamp": "2026-04-13T07:56:20Z",
         "action": {
         "trait": "TRAIT_ON_OFF",
         "actionType": "ONOFF_OFF"
         },
         "status": {
         "statusType": "SUCCESS_STATUS"
         },
         "endTimestamp": "2026-04-13T07:56:21Z",
         "executionType": "PARTNER_CLOUD"
      },
      "reportState": {}
   },
   "accuracy": "MISSING_REPORT_STATE",
   "deviceType": "action.devices.types.LIGHT",
   "agentId": "abc",
   "stateName": "on",
   "result": "MISSING_REPORT_STATE"
   }
Cause: With the DETAILED_ACCURACY_RESULT_MISSING_REPORT_STATE error, the
partner executed the command successfully, but did not report the updated
device state back to Google.
Solution: Always send a Report State update after command execution so Home Graph receives the new device state.
DETAILED_ACCURACY_RESULT_NO_STATE_REPORTED example
eportStateLog: {
    accuracy: "INACCURATE"
    agentId: "abc"
    detailedAccuracyResult: "DETAILED_ACCURACY_RESULT_NO_STATE_REPORTED"
    deviceId: "switch"
    deviceType: "action.devices.types.SWITCH"
    isMissingField: false
    isOffline: true
    queriedTime: "2026-04-13T13:53:26Z"
    queryReportStateDifferences: {
      queryState: "online    {
        online: false
      }
      "
      reportState: ""
    }
    reportedTime: "1970-01-01T00:00:00Z"
    requestId: "test001"
    result: "INACCURATE"
    snapshotTime: "2026-04-13T13:53:26Z"
    stateName: "online"
    traitName: "TRAIT_ONLINE"
   }
Cause: For the DETAILED_ACCURACY_RESULT_NO_STATE_REPORTED error, no Report
State has been received for this device (the state is empty and the reported
timestamp is at epoch), despite the QUERY results providing the current status.
This indicates that state updates are either not being triggered, are failing to
reach HomeGraph, or the device is not successfully reporting transitions in its
connectivity or operational status.
Solution: Ensure Report State is triggered and successfully sent for all state changes. Verify that the backend logic correctly handles status updates, confirms delivery success to the Google HomeGraph, and ensures the device consistently synchronizes its state to keep the user interface and automation engine accurate.